AoT_map Widget~
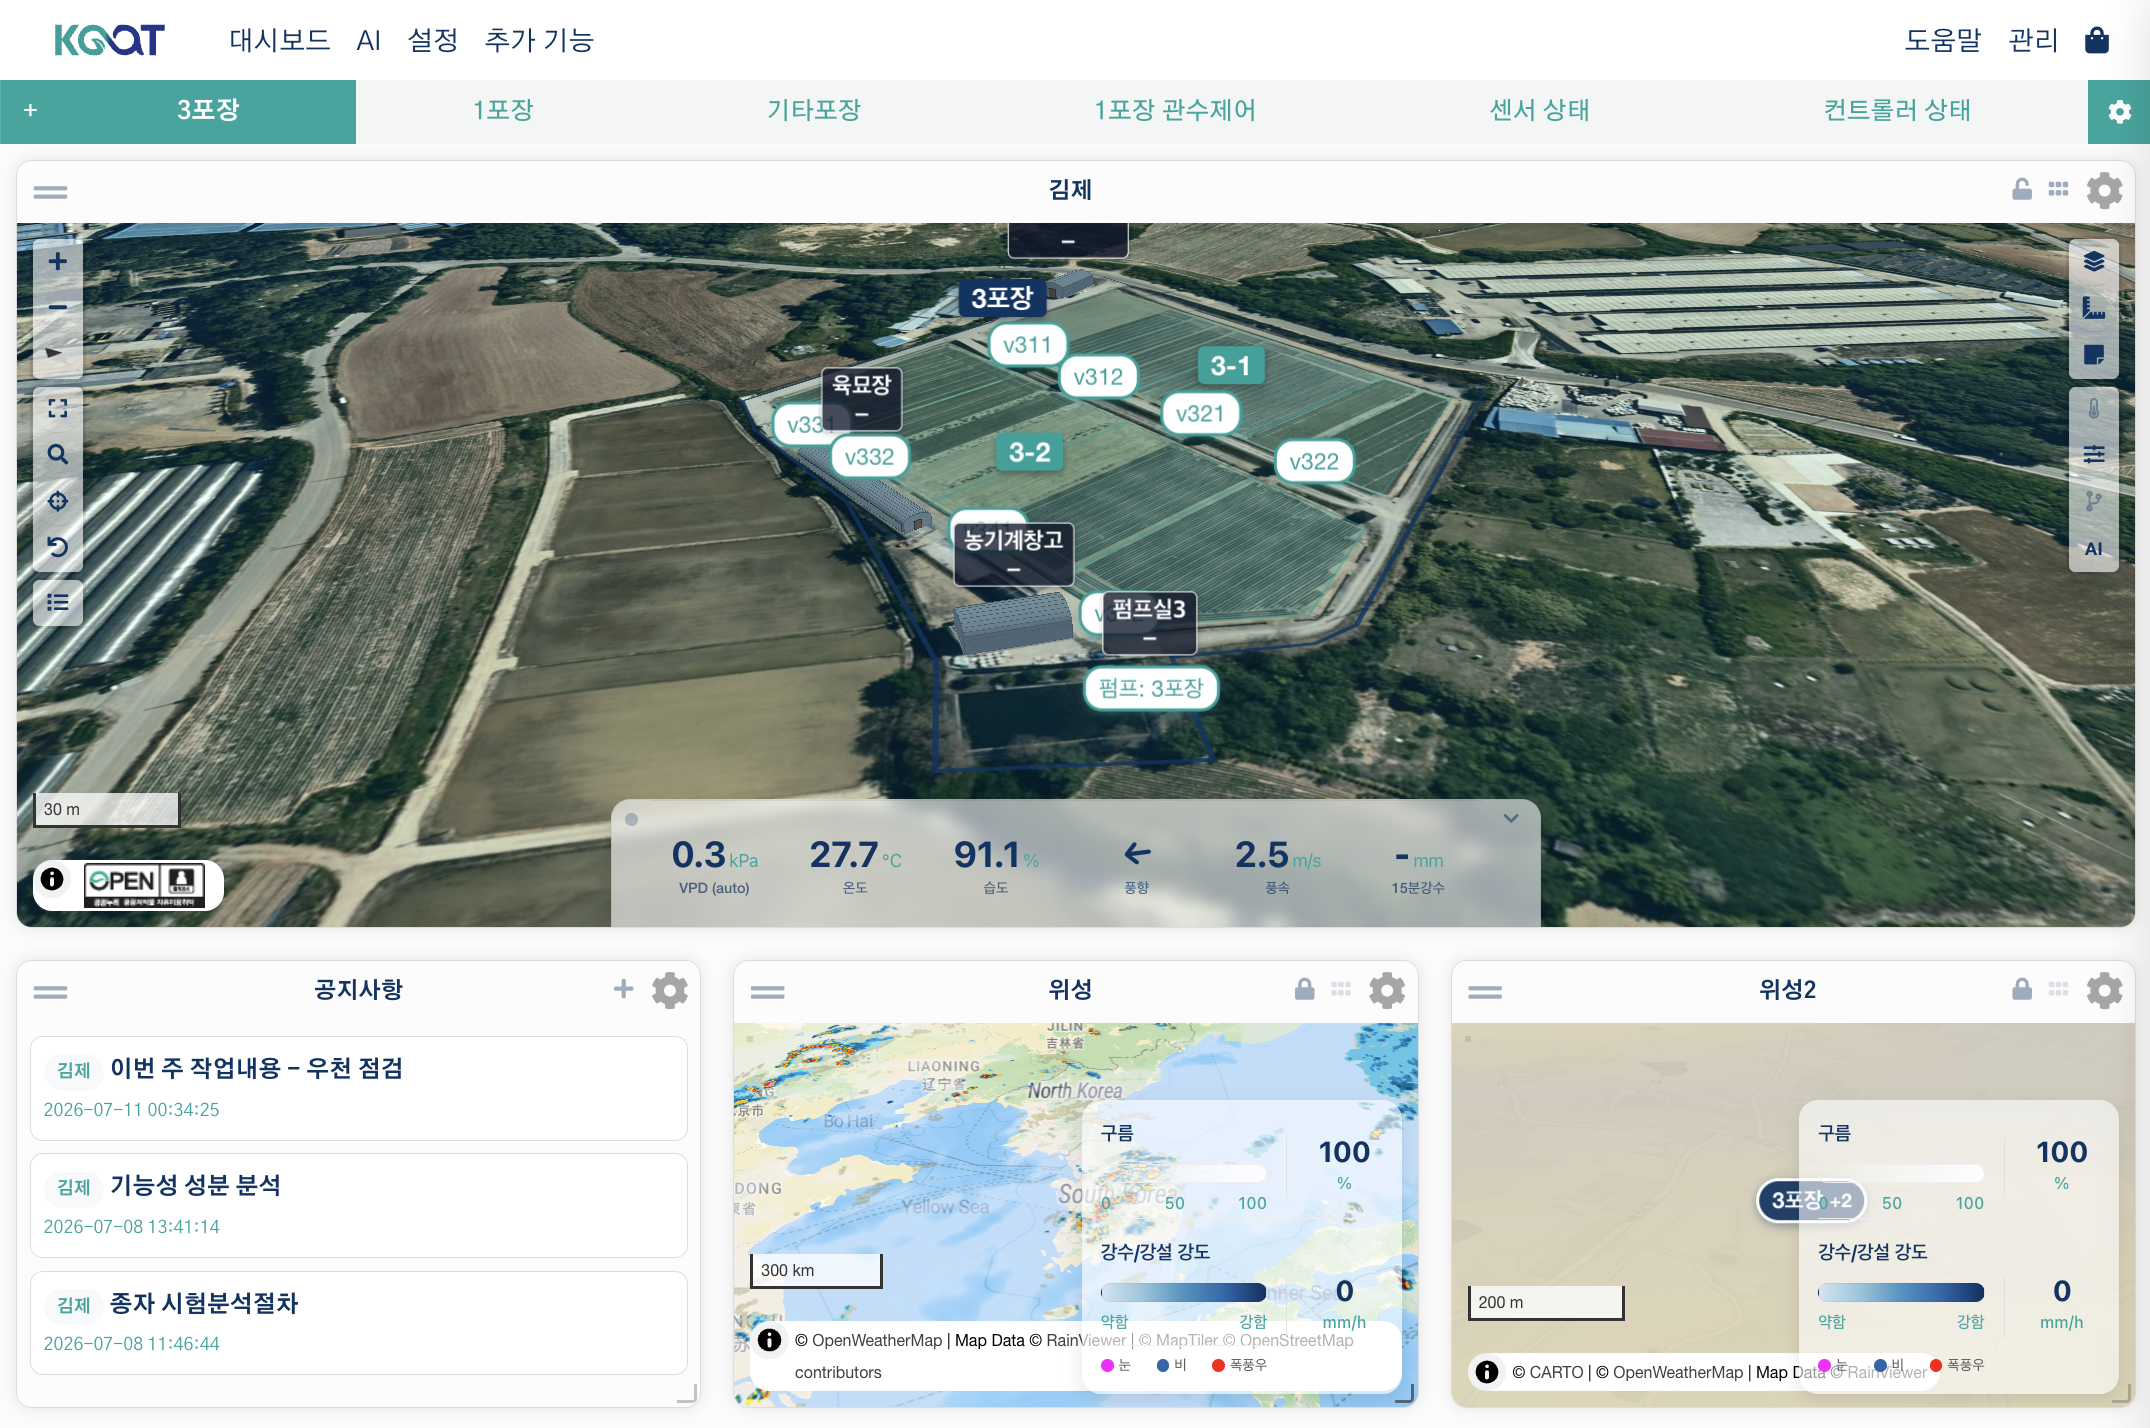
AoT_map is a dashboard widget that shows the sensors and devices scattered across your greenhouses on a single map, and lets you control them right there. Say you have 20 irrigation valves and 10 temperature/humidity sensors spread across 5 greenhouse bays — this one widget lets you see the whole layout at a glance, click a device to turn it on or off immediately, and check each location's latest readings and AI advice. It's built on MapLibre GL, so it supports 3D terrain, 3D facility rendering, and smooth zooming.
Adding the Widget~
- On the dashboard, select Add Widget → AoT Map.
- In the settings, choose the map to display (leave empty to use the most recently modified map).
- Click Save.
Key Features~
Device Markers~
Input, Output, and Function devices placed in Device mode in /geo/design appear as markers on the map.
- Marker color: Changes automatically based on the device's active/inactive/error state.
- Overlap handling: When markers overlap at a low zoom level, they collapse into a single badge showing the count; zooming in spreads them back out into individual markers.
- Device icons: Icons vary by device type (temperature sensor, relay, pump, and so on).
Control Right From the Popup~
Clicking a marker opens the window that fits the device type.
Input (sensor) — clicking a value key opens a detail window with a 24-hour chart, the current reading of every measurement, and a shortcut to write a note. It is the same window you get when opening a sensor from a facility or zone modal.
Output / function — opens the same centre window zones and facilities use, in three blocks from the top:
- History — the recent run chart. Before switching something on, what you want first is how much it has already run.
- Control — the device name and an On/Off toggle (shown only to users with edit permission), with the run time and a Settings button below it.
- Notes
The run time is one slot shared by two states. While the device is off it shows how long it last ran (dimmed); the moment it turns on that same slot becomes a live running timer (bold). It keeps following the device while the window stays open, even if another window or a schedule switches it.
Position actuators (windows, curtains, …) get Open/Stop/Close buttons and an opening-percentage slider instead.
Clicking a Facility marker shows a 3D preview and an environment-data summary — see 3D Facility Popup below.
Click a Zone/Site — Control From a Device List~
Clicking a Zone or Site shape opens a popup listing every sensor and output device placed inside it.
- Sensors: If there's more than one, switch between them with tabs to see a 24-hour chart.
- Output device list: On/Off toggle for immediate control (requires edit permission), drag to reorder. Run times follow the same rule as the device window (off = last run, on = live timer).
- Settings (schedule on): Each output has a Settings button — see Scheduled On.
Clicking a Plot — What Is Here~
Plots drawn in the design tool's Plot mode appear on the map; clicking one opens its operational view.
- [Status] — subject and variety, days elapsed, start date, plus a live Environment card with day-of-target readings including GDD (accumulated heat since the season started, see Journals) and DLI (today's light vs. target, see Journals) where the program and sensors support them. If either can't be calculated, the card says why (no program, no base temperature, not enough measured days) instead of just showing nothing.
- [Overview] > Program — current and next stage, accumulated heat, stage targets, and the actual state of the declared resources. Confirming, logging and undoing stage changes happens here too. See Management Programs.
- [Settings] > Stage schedule — where the real schedule is edited. Programme lengths are only a reference, so stages can be postponed or pulled forward, and this one plot can be set to advance automatically. See Editing the schedule.
Targets are read-only here
This popup shows each stage's targets but does not edit them — overriding a plot's own target is done from the /plots page or the AoT Plot widget, not from the map.
- Crop, variety, growing period, and days elapsed.
- Area and dimensions — width and length are shown together, because area alone cannot answer "how many rows fit here?".
- Irrigation — which valves wet this plot, and how much of it each one covers. One valve waters several crops and one crop may straddle two valves, so no single valve is designated; the overlapping areas are shown as they are. Percentages are relative to the plot ("how much of my bed gets wet"). Any part with no watering yet is shown rather than hidden.
- Sensors — sensors inside the plot, falling back to the parent zone's sensors if there are none.
- Notes — the same shared notes block as other shapes.
Water volume is not calculated
Water is physically shared across overlapping areas, so summing per-crop requirements produces a wrong number. The widget shows the inputs and leaves the judgement to you.
Plot labels (chips) appear from zoom 16 — the map already carries many labels, so always-on labels would collide. Toggle them from the layer control or the Show Plots setting; both share the same value.
Choosing the Representative Measurement~
The Status → Now block of a zone or facility window lists the readings inside it side by side. Click a value and that measurement becomes the representative one; it keeps a filled background so you can see which one is chosen. Click it again to clear (requires edit permission).
The choice is shared by three places:
- the value on the zone label / facility chip on the map
- the value on the zone/facility row of the site summary window
- the Now block itself (the highlight)
With nothing chosen, the order is VPD > temperature > humidity > CO₂ > light > wind speed. The choice is stored per zone and per facility, so a nursery can show temperature while an open field shows soil moisture. While the chosen sensor has no fresh reading the automatic order takes over temporarily; the choice comes back as soon as the sensor reports again.
Scheduled On~
The Settings button on an on/off output opens a window for picking a start and end time. It is the same window whether you open it from a zone modal, a facility modal, or a device marker popup.
- Leaving the end time at
00:00keeps the device on until you turn it off manually. - If the start time is effectively "now", it turns on immediately and switches off at the end time.
- If the start time is in the future, it is registered with the server scheduler. It runs as planned even if you close the browser, and you can review, edit, or cancel it on the Scheduler page.
- If registering fails (for example, no MCP server configured), you are asked whether to fall back to having the current tab wait and fire instead. Only in that case does closing the tab prevent it from running.
Position actuators (windows, curtains, …) do not get this button — "on from X until Y" has no meaning for them.
Real-Time Refresh~
The widget automatically refreshes device state at a configured interval (default: 5 seconds). Marker colors and measurement labels update live, and values keep refreshing even while a popup is open.
Map Tool Buttons~
The following tool buttons appear in a corner of the map:
| Button | Function |
|---|---|
| +/− | Zoom in / out |
| Fullscreen | Display the widget in fullscreen |
| Search | Search an address and fly to it |
| My Location | Move to your browser's GPS position |
| Reset | Return to the originally saved position and zoom |
| Site List | Pick a registered site or zone and jump straight to it |
| Copyright (ⓘ) | Shows the attribution for the currently displayed base/overlay maps. Opens automatically when the map first loads or when you switch the base/overlay, and collapses when you interact with the map (drag, zoom, touch). |
Separately, the widget's title bar has Lock Map (locks panning/zooming) and Hide Controls (hides the tool buttons) icons. These are toggled directly from the title bar, not from the settings form.
Widget Settings~
These follow the order of the settings panel. The collapsible groups (Device Filter, Measurement Panel, Label Style, Shapes, 3D Map) expand when clicked.
Basic~
| Option | Description |
|---|---|
| Select Map | The saved map to display. Leave empty to use the most recently modified map. |
| Show Labels | The master switch for all site/zone/facility/device/sensor labels. Fine-tune which types show up under Layers → Labels in the map's right-hand tools. |
| Display Data Only (Hide Map) | Hides the map background and overlays, showing only the side measurement panel. |
| Show AI Advice | Shows the latest AI advice summary for this map's facility/site as a clickable chip at the top of the map (requires the global AI to be configured). |
| Show Local Time | Shows a three-cell dock at the top-centre of the map with the time for wherever the map is centred — the current time in the middle, the sun event that just passed on the left, and the next one on the right. So it reads sunrise · now · sunset during the day and sunset · now · tomorrow's sunrise at night. Pan the map and it recomputes for that location's timezone. Scroll the wheel over the small circle at its bottom-left (drag vertically on a phone) to resize the clock; the size is saved with the widget. While it is on, the address search bar and AI advice chips move below it. |
| Period (Seconds) | How often device state is refreshed. Set to 0 to disable auto-refresh. (Default: 5s) |
Note
Switching Select Map to a different map automatically resets the stored position and zoom, so they can be re-fit to the new map.
Device Filter~
| Option | Description |
|---|---|
| Input / Output / Function | Choose which devices of each type to hide from the map (an exclude list). If none are selected, every device placed in /geo/design is shown — only use this to hide specific devices. |
Measurement Panel~
| Option | Description |
|---|---|
| Input / Output / Function | Choose which measurements of each type are shown in the side data panel. |
Label Style~
Applies to both name labels (site/zone/facility) and value keys (input sensor readings). Whether they show at all still follows the Show Labels master switch above.
| Option | Default | Description |
|---|---|---|
| Prevent Label Collision | On | Clusters overlapping labels automatically. The more specific label survives — function > input > output > equipment > facility > zone > site claim space in that order, and whatever yields is surfaced as a name +N badge rather than disappearing silently. |
| Label Text Size | 1.0 | Font size (em) of every map label and value key. 1.0–3.0. |
| Hide Labels When Zoomed Out — L1 | 17 | Below this zoom level, output / input / function / equipment / sensor / plot / bay / note labels and value keys are hidden. Site labels always stay visible so the map keeps its bearings, and while input labels are hidden the zone label carries the reading instead (see Zone Labels below). Zone and facility labels use the wider L2 threshold below. Set 0 to never hide. |
| Hide Labels & Shapes When Zoomed Out — L2 | 15.5 | A second, independent threshold for the things that need to stay readable at a wider view than L1: zone and facility labels, and zone / plot / equipment shapes. Site shapes and device markers are never culled by zoom. A running output normally keeps its label and shape visible even when hidden — but below this zoom it folds away too, unless its window is open. Set 0 to never hide. |
| Facility-centric Labels | Off | Switches the per-zoom exposure rules between outdoor-centric (off, default) and facility-centric (on). Stacking order — which label draws on top — is unaffected and is always site > zone > facility > equipment > output > input > function. |
| Sensor Marker Style | Circle | Circle (a compact round marker showing the representative value as an integer, colored by measurement band) or Text (value with unit). |
| Enable Sensor Popup | On | Clicking a value key opens a detail window with a 24-hour chart. |
Note
Hovering or clicking any label brings it to the very front, whatever its type. A label you clicked stays in front until the window it opened is closed.
Zone Labels — Name Only vs Reading~
A zone label carries a reading only while input labels are not visible.
| Input labels | Zone label |
|---|---|
| Visible | Name only (3-2) |
| Hidden — turned off in the label controller, or zoomed out past Hide Labels When Zoomed Out — L1 above | Name + representative reading + measurement-band colour (3-2 / 32.4°C), plus a corner dot when something needs attention |
If the input labels are already stating the readings, a zone label repeating one puts the same number on screen twice and paints the band colour in two layers, so you cannot tell which one is the reference. Zoom out far enough that the input labels disappear, though, and that is exactly when you most want a number — so the zone label takes over, and hands it back when you zoom in again.
Which measurement it shows is set per zone under Choosing the Representative Measurement.
Shapes~
Toggles, by type, whether the polygons you drew in the design tool are shown as translucent overlays on the map.
| Option | Description |
|---|---|
| Site Shape | Site boundaries (using the configured theme color). |
| Zone Shape | Zone boundaries. |
| Facility Shape | Building footprints. |
| Equipment Shape | Shapes for equipment such as pipes. |
| Device Shape | The area a device occupies. |
| Show Plots | Plots (what is where). Plot labels appear from zoom 16. |
| Other Drawn Shapes | Freeform shapes made with the drawing tools. |
| Device Shape Opacity | Opacity of the device shapes above (0–100) — 0 is transparent, 100 is fully opaque. |
3D Map (Vector Mode)~
| Option | Description |
|---|---|
| Enable 3D Terrain | Turns on elevation-based 3D terrain (hillshade) rendering. |
| Facility Render Mode | How 3D facility (building) models are drawn: Default (translucent) / Solid (opaque) / Wireframe / Performance (for mobile, minimizes load). |
| Vector Style URL | A custom MapLibre style JSON, if you need one. Leave empty to use the GIS input setting. |
Values Saved Automatically~
These are not in the settings panel — the widget remembers them as you use the map. You never type them in.
| Value | Saved when |
|---|---|
| Position, zoom, pitch, bearing | You pan, zoom, or tilt the map |
| Active overlay layers / selected base map | You use the map's layer picker |
| Per-type label visibility | You use the toolbar label buttons or the Layers → Labels checkboxes |
| Map lock / hidden controls | You press those tool buttons |
Legend~
A legend is displayed automatically in the bottom-right of the map — there's no setting to configure it. It explains the colors of whichever overlay layers are currently active and the Input/Output device icons; clicking a legend entry toggles that layer or device type on or off.
3D Facility Popup~
Clicking a Facility marker or polygon shows a brief 3D preview and an environment-data summary in a popup. The Overview pane's environment card includes GDD and DLI the same way a plot's does — for the facility as a whole, regardless of which bay you're looking at. For the full facility view, use the AoT_facility widget.
Site Weather Station~
A site's popup has an About pane, and in it a Weather station section for telling AoT which of the site's own devices to trust for sunlight and rainfall — values a plot or zone inside that site borrows rather than measuring itself (see Journals and day/night targets).
- Left unset, AoT infers a source automatically from what each device measures — a safety net for installations where nobody has touched this setting, not a guarantee. If the site has two solar sensors, or one of them is experimental, there is no way to tell AoT which one is authoritative without setting it here.
- Checking one or more devices designates them explicitly; that designation now overrides the automatic guess.
- Unchecking everything is "not designated," not "off." It returns the site to automatic inference — it does not stop weather values from showing.
Multiple Maps on One Dashboard~
You can add multiple AoT_map widgets to the same dashboard, each showing a different map — for example, an overview map of the whole site alongside a zoomed-in view of one specific bay.
Related Pages~
- Design Tool — Placing devices and shapes
- Facility Widget — The dedicated 3D facility widget
- GIS Layers — Registering overlay layers
- Journals — Snapshot documents built from the same GDD/DLI/irrigation data
- AoT Plot Widget — Dashboard widget for keeping one plot in view, with target editing this popup doesn't have