AoT_map ウィジェット~
AoT_map は、ハウス全体に散らばるセンサーやデバイスをひとつの地図上にまとめて表示し、その場から操作もできるダッシュボードウィジェットです。たとえば5棟のハウスに灌漑バルブが20台、温湿度センサーが10台散らばっているとしましょう — このウィジェットひとつで配置全体をひと目で把握でき、デバイスをクリックしてその場でオン/オフを切り替え、各地点の最新の実測値とAIアドバイスを確認できます。MapLibre GL上に構築されているため、3D地形、3D施設レンダリング、なめらかなズームに対応しています。
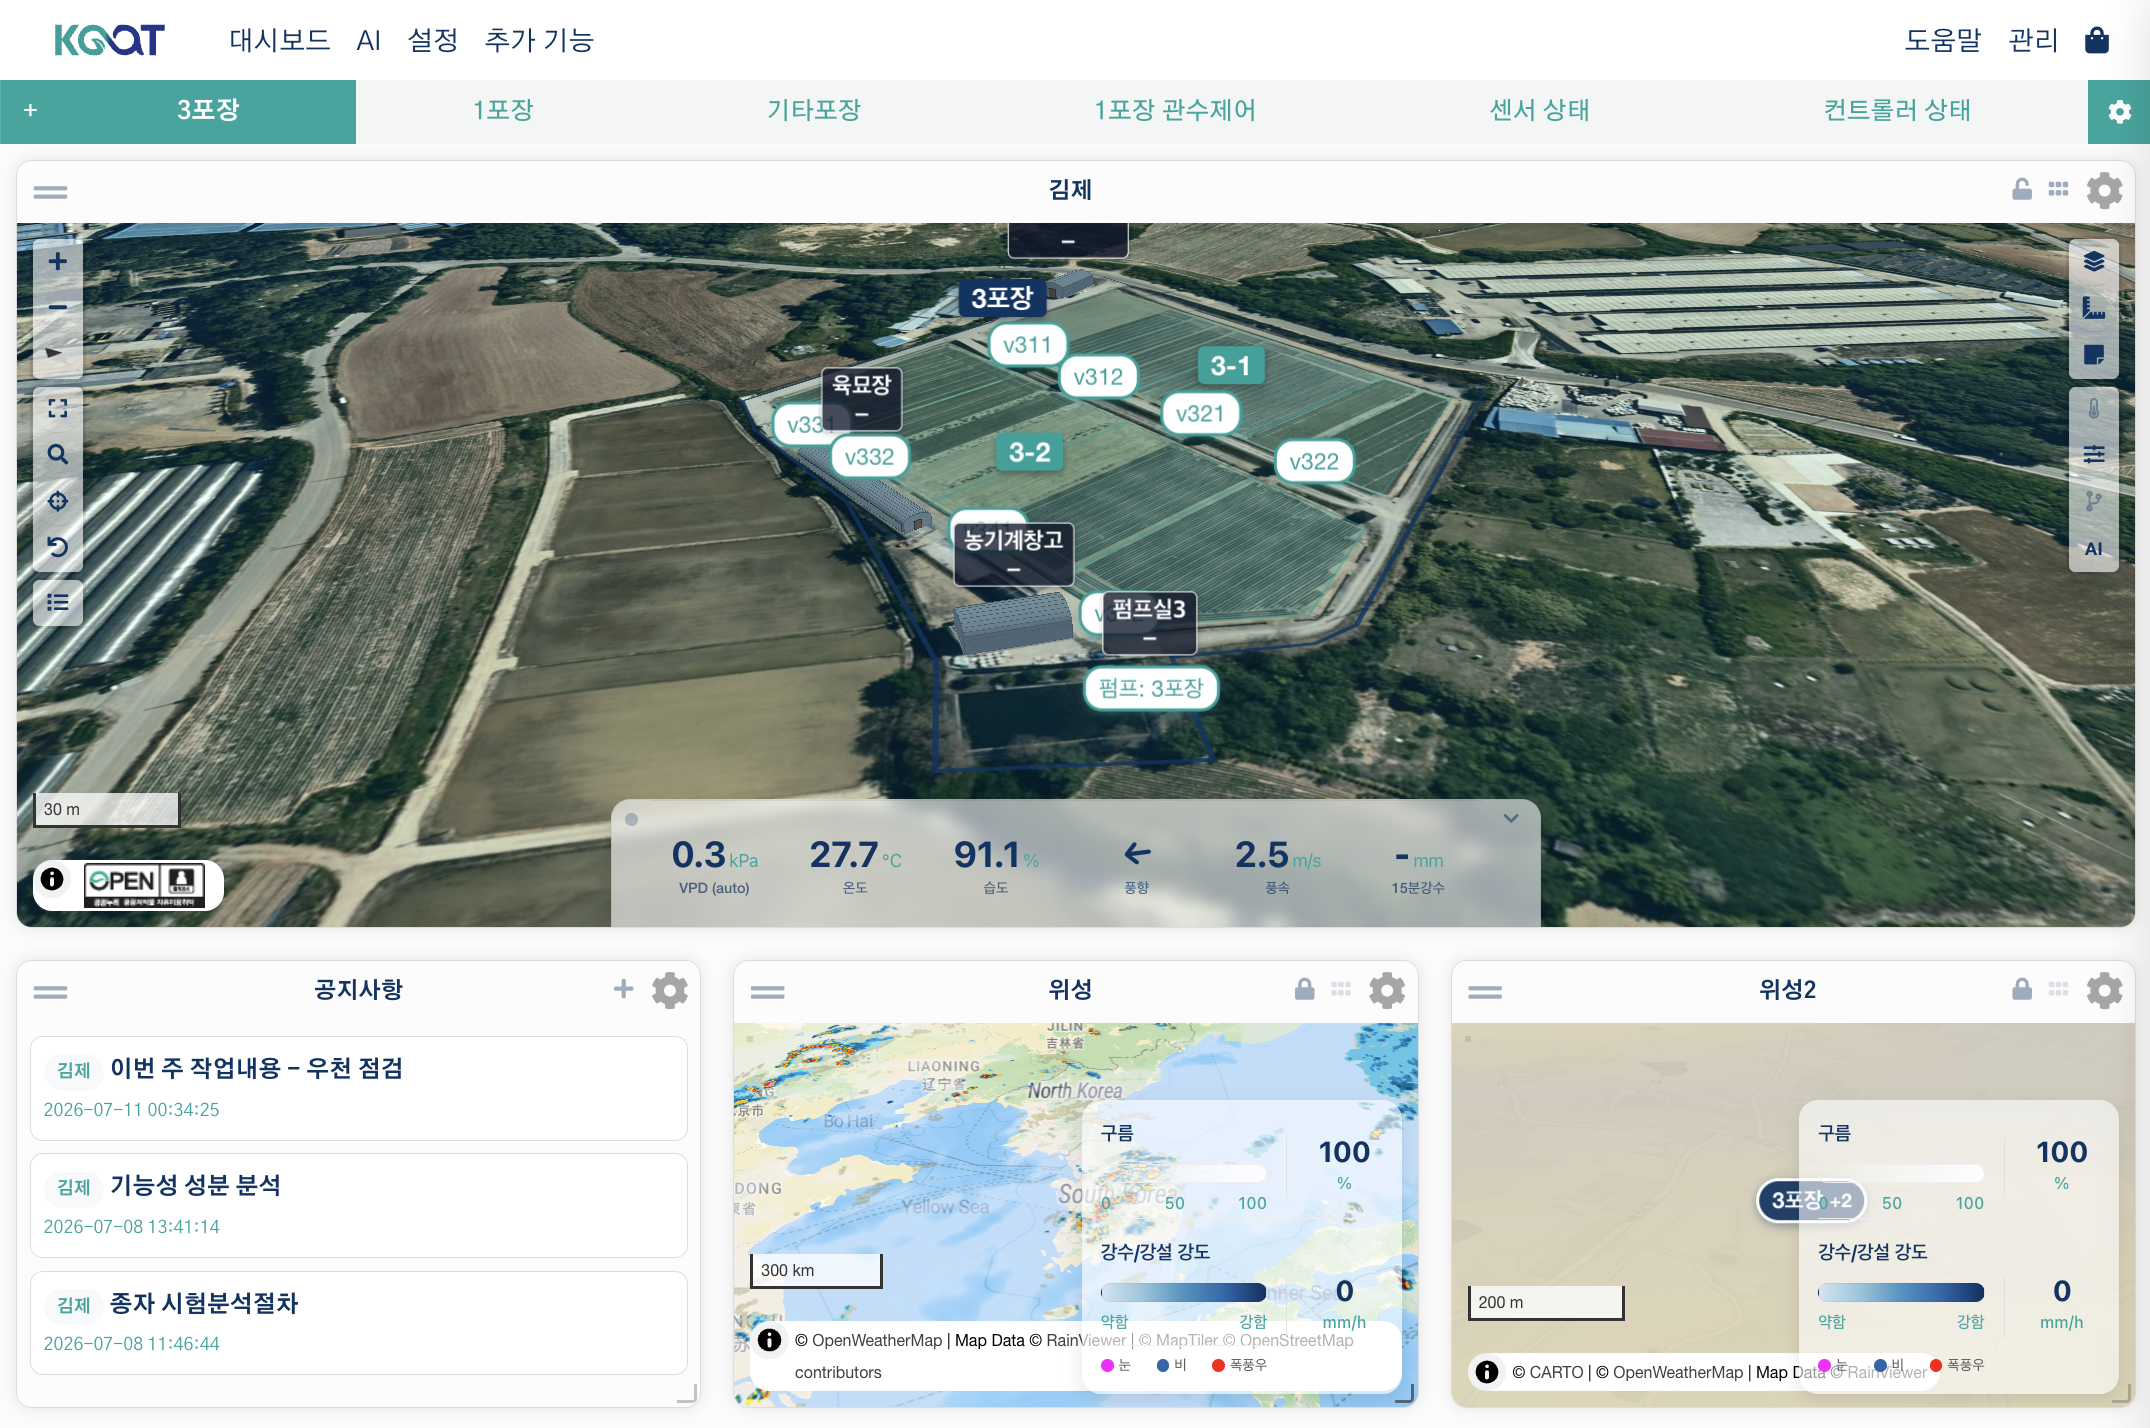
ウィジェットを追加する~
- ダッシュボードで Add Widget → AoT Map を選択します。
- 設定で表示する地図を選びます(空欄のままにすると、直近に編集された地図が使われます)。
- Save をクリックします。
主な機能~
デバイスマーカー~
/geo/design の Device モードに配置されたInput・Output・Functionデバイスは、地図上にマーカーとして表示されます。
- マーカーの色: デバイスの動作中/停止中/エラーの状態に応じて自動的に変わります。
- 重なりの処理: 低いズームレベルでマーカーが重なると、件数を示すひとつのバッジにまとまります。ズームインすると個別のマーカーに戻ります。
- デバイスアイコン: デバイスの種類(温度センサー、リレー、ポンプなど)によってアイコンが変わります。
ポップアップからその場で操作する~
マーカーをクリックすると、そのデバイスの種類に合ったウィンドウが開きます。
Input(センサー) — 測定値のラベルをクリックすると、過去24時間のチャート、すべての測定項目の現在値、ノートを書くためのショートカットを備えた詳細ウィンドウが開きます。これは、施設やゾーンのモーダルからセンサーを開いたときに表示されるまったく同じウィンドウです。
Output / Function — ゾーンや施設で使うのと同じ中央ウィンドウが開き、上から3つのブロックで構成されます。
- History — 直近の稼働履歴チャート。何かをオンにする前に、まず知りたいのはそれがすでにどれだけ稼働しているかです。
- Control — デバイス名とオン/オフの切り替え(編集権限を持つユーザーにのみ表示されます)。その下に稼働時間と Settings ボタンがあります。
- Notes
稼働時間は2つの状態を1つの表示枠で共有します。デバイスがオフの間は、最後に稼働していた時間を(薄く)表示し、オンになった瞬間、その同じ枠がライブの経過タイマー(太字)に変わります。ウィンドウが開いている間は、別のウィンドウやスケジュールが切り替えを行った場合でも、そのデバイスを追い続けます。
ポジションアクチュエーター(窓、カーテンなど)には、代わりにOpen/Stop/Closeボタンと開度スライダーが表示されます。
Facilityマーカーをクリックすると、3Dプレビューと環境データのサマリーが表示されます — 詳しくは下記の3Dファシリティポップアップを参照してください。
ゾーン/サイトをクリックする — デバイス一覧から操作する~
ZoneまたはSiteの図形をクリックすると、その中に配置されているすべてのセンサーと出力デバイスを一覧表示するポップアップが開きます。
- センサー: 2つ以上ある場合は、タブで切り替えて24時間チャートを確認できます。
- 出力デバイス一覧: オン/オフの切り替え(編集権限が必要)でその場から操作でき、ドラッグして並べ替えられます。稼働時間はデバイスウィンドウと同じ規則に従います(オフ=最後の稼働時間、オン=ライブタイマー)。
- Settings(スケジュールオン): 各出力には Settings ボタンがあります — スケジュールオンを参照してください。
区画をクリックする — ここには何があるか~
デザインツールのPlotモードで描かれた区画は地図上に表示され、クリックするとその運用状況が開きます。
- [Status] — 対象と品種、経過日数、開始日に加えて、プログラムとセンサーが対応していればGDD(作期開始からの積算温度、日誌を参照)とDLI(今日の光量と目標の対比、日誌を参照)を含む、当日の目標対比の実測値をリアルタイムで示すEnvironmentカードが表示されます。どちらかが計算できない場合は、何も表示しないのではなく、カードにその理由(プログラムがない、基準温度がない、実測日数が足りない)が表示されます。
- [Overview] > Program — 現在および次のステージ、積算温度、ステージごとの目標、そして宣言された資源の実際の状態です。ステージの変更の確認・記録・取り消しもここで行います。管理プログラムを参照してください。
- [Settings] > Stage schedule — 実際の日程を編集する場所です。プログラムの長さはあくまで参照値なので、ステージを延期または前倒しでき、この区画だけを自動的に進めるよう設定することもできます。日程を編集するを参照してください。
目標はここでは読み取り専用です
このポップアップには各ステージの目標が表示されますが、編集はできません — 区画自身の目標を上書きするには、地図からではなく/plots ページまたはAoT Plotウィジェットを使います。
- 作物、品種、生育期間、経過日数。
- 面積と寸法 — 幅と長さが併記されます。面積だけでは「ここに何列入るか」に答えられないためです。
- 灌漑 — この区画を潤しているバルブと、それぞれが受け持つ範囲。ひとつのバルブが複数の作物に水をやり、ひとつの作物が2つのバルブにまたがることもあるため、単一のバルブが指定されることはなく、重なり合う範囲はそのまま示されます。割合はその区画に対する割合です(「自分の畝のどれだけが潤っているか」)。まだ灌水されていない部分は、隠さずそのまま表示されます。
- センサー — 区画内のセンサー。なければ親ゾーンのセンサーにフォールバックします。
- Notes — 他の図形と同じ共有ノートブロックです。
水量は計算されません
水は物理的に重なり合う範囲で共有されるため、作物ごとの必要量を単純に合計すると誤った数字になります。このウィジェットは入力値を示すだけで、判断はユーザーに委ねられます。
区画のラベル(チップ)はズーム16から表示されます — 地図にはすでに多くのラベルがあるため、常時表示にすると衝突してしまいます。レイヤーコントロールまたは Show Plots 設定から切り替えられます。どちらも同じ値を共有します。
代表測定値を選ぶ~
ゾーンまたは施設ウィンドウの Status → Now ブロックには、その中の実測値が横に並んで表示されます。値をクリックすると、その測定値が代表測定値になります。代表測定値は背景が塗りつぶされて表示されるため、どれが選ばれているか一目でわかります。もう一度クリックすると解除されます(編集権限が必要です)。
この選択は次の3か所で共有されます。
- 地図上のゾーンラベル/施設チップの値
- サイトサマリーウィンドウのゾーン/施設の行の値
- Nowブロック自体(ハイライト)
何も選ばれていない場合の順序は、VPD > 温度 > 湿度 > CO₂ > 光 > 風速です。この選択はゾーンごと・施設ごとに保存されるため、育苗施設では温度を、露地では土壌水分を表示するといった使い分けができます。選ばれたセンサーに最新の実測値がない間は、自動順序が一時的に代わりを務め、そのセンサーが再び値を報告し次第、選択された表示に戻ります。
スケジュールオン~
オン/オフの出力にある Settings ボタンをクリックすると、開始時刻と終了時刻を選ぶウィンドウが開きます。ゾーンモーダル、施設モーダル、デバイスマーカーのポップアップのどこから開いても同じウィンドウです。
- 終了時刻を
00:00のままにすると、手動でオフにするまでデバイスはオンのままになります。 - 開始時刻が実質的に「今」であれば、即座にオンになり、終了時刻でオフになります。
- 開始時刻が未来の場合、サーバー側のスケジューラーに登録されます。ブラウザを閉じても予定どおり実行され、Schedulerページで確認・編集・キャンセルできます。
- 登録に失敗した場合(MCPサーバーが設定されていないなど)、現在のタブを開いたまま待機して実行する方式にフォールバックするかどうかを尋ねられます。この場合に限り、タブを閉じると実行されなくなります。
ポジションアクチュエーター(窓、カーテンなど)にはこのボタンはありません — 「XからYまでオン」という概念自体が成り立たないためです。
リアルタイム更新~
このウィジェットは、設定された間隔(デフォルト: 5秒)でデバイスの状態を自動的に更新します。マーカーの色と測定値のラベルはライブで更新され、ポップアップが開いている間も値は更新され続けます。
地図のツールボタン~
地図の隅には、次のツールボタンが表示されます。
| ボタン | 機能 |
|---|---|
| +/− | ズームイン/ズームアウト |
| フルスクリーン | ウィジェットをフルスクリーン表示 |
| 検索 | 住所を検索してその場所に移動 |
| 現在地 | ブラウザのGPS位置に移動 |
| リセット | 最初に保存された位置とズームに戻す |
| サイト一覧 | 登録済みのサイトまたはゾーンを選んで直接ジャンプ |
| 著作権(ⓘ) | 現在表示されているベース/オーバーレイ地図の帰属表示を表示します。地図の初回読み込み時、またはベース/オーバーレイを切り替えたときに自動的に開き、地図を操作する(ドラッグ、ズーム、タッチ)と折りたたまれます。 |
これとは別に、ウィジェットのタイトルバーには Lock Map(パン・ズームをロック)と Hide Controls(ツールボタンを非表示)のアイコンがあります。これらは設定フォームからではなく、タイトルバーから直接切り替えます。
ウィジェット設定~
以下は設定パネルの並び順に従っています。折りたたみ可能なグループ(Device Filter、Measurement Panel、Label Style、Shapes、3D Map)はクリックすると展開されます。
Basic~
| オプション | 説明 |
|---|---|
| Select Map | 表示する保存済みの地図です。空欄のままにすると、直近に編集された地図が使われます。 |
| Show Labels | サイト/ゾーン/施設/デバイス/センサーのすべてのラベルのマスタースイッチです。どの種類を表示するかは、地図右側のツールにある Layers → Labels で細かく調整します。 |
| Display Data Only (Hide Map) | 地図の背景とオーバーレイを非表示にし、横の測定パネルだけを表示します。 |
| Show AI Advice | この地図の施設/サイトに対する最新のAIアドバイスの要約を、地図上部にクリック可能なチップとして表示します(グローバルAIの設定が必要です)。 |
| Show Local Time | 地図の中心が置かれているその場所の時刻を示す3セルのドックを、地図上部中央に表示します。中央に現在時刻、左に直前に過ぎた太陽イベント、右に次の太陽イベントが表示されます。そのため昼間は「日の出・現在時刻・日の入り」、夜間は「日の入り・現在時刻・翌日の日の出」という並びになります。地図をパンすると、その場所のタイムゾーンに合わせて再計算されます。左下の小さな円の上でホイールをスクロールする(スマートフォンでは縦にドラッグする)と時計のサイズを変更でき、そのサイズはウィジェットとともに保存されます。表示中は、住所検索バーとAIアドバイスのチップがその下に移動します。 |
| Period (Seconds) | デバイスの状態を更新する頻度です。0にすると自動更新が無効になります(デフォルト: 5秒)。 |
Note
Select Map を別の地図に切り替えると、保存されていた位置とズームは自動的にリセットされ、新しい地図に合わせて再調整できるようになります。
Device Filter~
| オプション | 説明 |
|---|---|
| Input / Output / Function | 地図から非表示にするデバイスの種類ごとの一覧です(除外リスト)。何も選ばれていない場合は、/geo/design に配置されたすべてのデバイスが表示されます — 特定のデバイスだけを隠したいときにのみ使用してください。 |
Measurement Panel~
| オプション | 説明 |
|---|---|
| Input / Output / Function | 横の測定パネルに表示する種類ごとの測定項目です。 |
Label Style~
名前ラベル(サイト/ゾーン/施設)と、値のラベル(Inputセンサーの実測値)の両方に適用されます。そもそも表示されるかどうかは、上記の Show Labels マスタースイッチに従います。
| オプション | デフォルト | 説明 |
|---|---|---|
| Prevent Label Collision | オン | 重なり合うラベルを自動的にクラスター化します。より具体的なラベルが優先されます — function > input > output > equipment > facility > zone > siteの順にスペースを占有し、譲る側は消えるのではなく 名前 +N バッジとして示されます。 |
| Label Text Size | 1.0 | 地図上のすべてのラベルと値のラベルの文字サイズ(em)です。1.0〜3.0。 |
| Hide Labels When Zoomed Out — L1 | 17 | このズームレベルより下では、output/input/function/equipment/sensor/plot/bay/noteのラベルと値のラベルが非表示になります。サイトラベルは地図の位置感覚を保つため常に表示されたままです。Inputラベルが非表示の間は、代わりにゾーンラベルが実測値を表示します(下記のゾーンラベルを参照)。ゾーンと施設のラベルは、下記のより広いL2しきい値に従います。0に設定すると常に表示されます。 |
| Hide Labels & Shapes When Zoomed Out — L2 | 15.5 | L1よりも広い表示でも読み取れる必要があるもの — ゾーンと施設のラベル、およびゾーン/区画/機器の図形 — のための、独立した第2のしきい値です。サイトの図形とデバイスマーカーは、ズームによって間引かれることはありません。稼働中の出力は、非表示状態でも通常はラベルと図形が表示されたままですが、このズームを下回るとウィンドウが開いている場合を除いて折りたたまれます。0に設定すると常に表示されます。 |
| Facility-centric Labels | オフ | ズームレベルごとの表示ルールを、屋外中心(オフ、デフォルト)と施設中心(オン)の間で切り替えます。どのラベルが上に描かれるかという重なり順には影響せず、常に site > zone > facility > equipment > output > input > functionの順です。 |
| Sensor Marker Style | Circle | Circle(代表値を整数で示すコンパクトな円形マーカーで、測定バンドごとに色分け)またはText(単位付きの値)。 |
| Enable Sensor Popup | オン | 値のラベルをクリックすると、24時間チャート付きの詳細ウィンドウが開きます。 |
Note
どのラベルも、ホバーまたはクリックすると種類にかかわらず最前面に来ます。 クリックしたラベルは、開いたウィンドウが閉じられるまで最前面のままです。
ゾーンラベル — 名前のみ vs 実測値~
ゾーンラベルが実測値を表示するのは、Inputラベルが表示されていない間だけです。
| Inputラベル | ゾーンラベル |
|---|---|
| 表示 | 名前のみ(3-2) |
| 非表示 — ラベルコントローラーでオフにした場合、または上記のHide Labels When Zoomed Out — L1を超えてズームアウトした場合 | 名前 + 代表実測値 + 測定バンドの色(3-2 / 32.4°C)。何か注意が必要な場合は角にドットが付きます |
Inputラベルがすでに実測値を示しているのに、ゾーンラベルが同じ値を繰り返すと、同じ数字が画面に二重に表示され、バンドの色も二重に塗られてしまい、どちらが基準か分からなくなります。ところが、ズームアウトしてInputラベルが消えるところこそ、数字が最も欲しい瞬間です — そこでゾーンラベルが代わりを務め、ズームインすると再び役割を戻します。
どの測定項目を表示するかは、ゾーンごとに代表測定値を選ぶで設定します。
Shapes~
デザインツールで描いたポリゴンを、種類ごとに半透明のオーバーレイとして地図に表示するかどうかを切り替えます。
| オプション | 説明 |
|---|---|
| Site Shape | サイト境界(設定されたテーマカラーを使用)。 |
| Zone Shape | ゾーン境界。 |
| Facility Shape | 建物のフットプリント。 |
| Equipment Shape | 配管などの機器の形状。 |
| Device Shape | デバイスが占める範囲。 |
| Show Plots | 区画(どこに何があるか)。区画のラベルはズーム16から表示されます。 |
| Other Drawn Shapes | 描画ツールで作成した自由形の図形。 |
| Device Shape Opacity | 上記のデバイス形状の不透明度(0〜100)— 0が透明、100が完全に不透明です。 |
3D Map (Vector Mode)~
| オプション | 説明 |
|---|---|
| Enable 3D Terrain | 標高に基づく3D地形(ヒルシェード)レンダリングを有効にします。 |
| Facility Render Mode | 3D施設(建物)モデルの描画方法です: Default(半透明)/Solid(不透明)/Wireframe/Performance(モバイル向け、負荷を最小化)。 |
| Vector Style URL | 独自のMapLibreスタイルJSONが必要な場合に指定します。空欄のままにするとGIS Input設定が使われます。 |
自動的に保存される値~
これらは設定パネルにはありません — 地図を使っているうちにウィジェットが自動的に記憶します。自分で入力する必要はありません。
| 値 | 保存されるタイミング |
|---|---|
| 位置、ズーム、ピッチ、方位 | 地図をパン、ズーム、傾けたとき |
| アクティブなオーバーレイレイヤー/選択中のベースマップ | 地図のレイヤーピッカーを使ったとき |
| 種類ごとのラベル表示設定 | ツールバーのラベルボタンまたは Layers → Labels のチェックボックスを使ったとき |
| 地図のロック/コントロールの非表示 | それらのツールボタンを押したとき |
凡例~
地図の右下には凡例が自動的に表示されます — 設定項目はありません。現在有効なオーバーレイレイヤーの色とInput/Outputデバイスのアイコンを説明し、凡例の項目をクリックすると、そのレイヤーまたはデバイスの種類の表示・非表示を切り替えられます。
3Dファシリティポップアップ~
Facilityのマーカーまたはポリゴンをクリックすると、ポップアップに簡単な3Dプレビューと環境データのサマリーが表示されます。Overviewペインの環境カードには、区画のものと同じ方法でGDDとDLIが含まれます — ただし、どの棟を見ているかにかかわらず対象は施設全体です。施設全体のビューにはAoT_facilityウィジェットを使用してください。
サイトの気象観測ステーション~
サイトのポップアップには About ペインがあり、その中に Weather station セクションがあります。ここで、日射量と降水量についてどのサイト自身のデバイスを信頼するかをAoTに指定します — その値は、サイト内の区画やゾーンが自分で測定するのではなく借用する値です(日誌と昼夜の目標を参照してください)。
- 未設定のままにすると、AoTは各デバイスが測定している内容から自動的に情報源を推測します — これは、誰もこの設定を触っていない導入環境のための安全策であって、保証ではありません。サイトに日射センサーが2台ある場合や、そのうち一方が実験用の場合、ここで設定しない限りAoTにどちらを正とするか伝える方法はありません。
- 1台以上のデバイスにチェックを入れると、それらを明示的に指定したことになります。その指定は、これ以降自動推測より優先されます。
- すべてのチェックを外すことは「オフ」ではなく「指定なし」を意味します。 サイトは自動推測に戻るだけで、気象値の表示が止まるわけではありません。
ひとつのダッシュボードに複数の地図を置く~
同じダッシュボードに複数の AoT_map ウィジェットを追加し、それぞれ異なる地図を表示することができます — たとえばサイト全体の俯瞰図と、特定の1棟だけを拡大表示するビューを並べて置く、といった使い方です。
関連ページ~
- Design Tool(デザインツール) — デバイスや図形を配置する場所
- Facility Widget(施設ウィジェット) — 専用の3D施設ウィジェット
- GIS Layers(GISレイヤー) — オーバーレイレイヤーの登録
- Journals(日誌) — 同じGDD/DLI/灌漑データから作られるスナップショット文書
- AoT Plot Widget(AoT_plotウィジェット) — ひとつの区画を表示し続けるダッシュボードウィジェット。このポップアップにはない目標編集機能があります